Welcome to pyclustertend’s documentation!
Deployment & Documentation & Stats


Build Status & Coverage & Maintainability & License

pyclustertend is a Python toolkit for assessing cluster tendency. Cluster tendency is about discovering the existence of clusters in data (http://www.sthda.com/english/wiki/print.php?id=238).
Introduction
When clustering is used, a workflow that can be used is to follow those steps:
- cluster tendency assessment : Check wether the clustering can bring something relative to the data in question.
- apply clustering : Use one of the many clustering algorithm to obtain a segmentation of data.
- cluster validation : Assess the quality of the clustering
This package have for main purpose to gather the most notable methods to do cluster tendency assessment.
Package description of module
The methods currently developed in the package are :
- Hopkins test
A statistical test which allow to guess if the data follow an uniform distribution. If the test is positve (an hopkins score which tends to 0) it means that the data is not uniformly distributed. Hence clustering can be useful to classify the observations. However, if the score is too high (above 0.3 for exemple); the data is uniformly distributed and clustering can’t be really useful for the problem at hand.
- VAT
VAT (visual assessment of tendency) is a algorithm which create a visualisation of a specific dataset, this visualisation can be useful to obtain an insight on the number of cluster and cluster hierarchy. The algorithm create a minimum spanning tree of observations, The pairwise distance between those observations are displayed. The more the color is black, the more the distance between two observations is small. A way to interpert the image is to count the number of black square in the diagonal which should represent the number of cluster.
from sklearn import datasets
from pyclustertend import vat
from sklearn.preprocessing import scale
X = scale(datasets.load_iris().data)
vat(X)
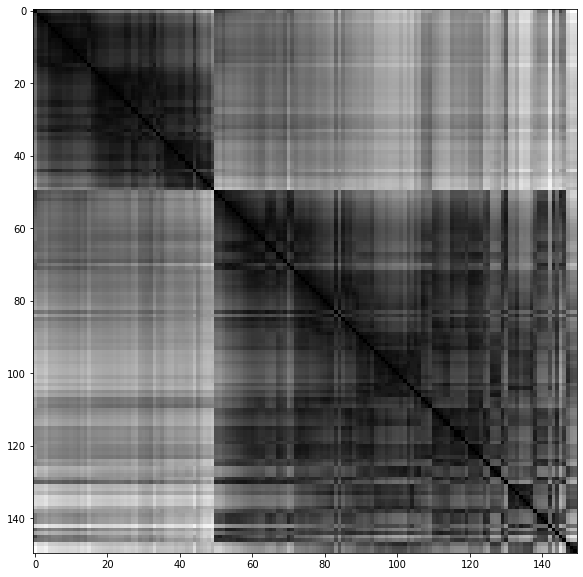
For the iris dataset, we can conclude that they are 2 clusters.
from sklearn import datasets
from pyclustertend import ivat
from sklearn.preprocessing import scale
X = scale(datasets.load_iris().data)
ivat(X)
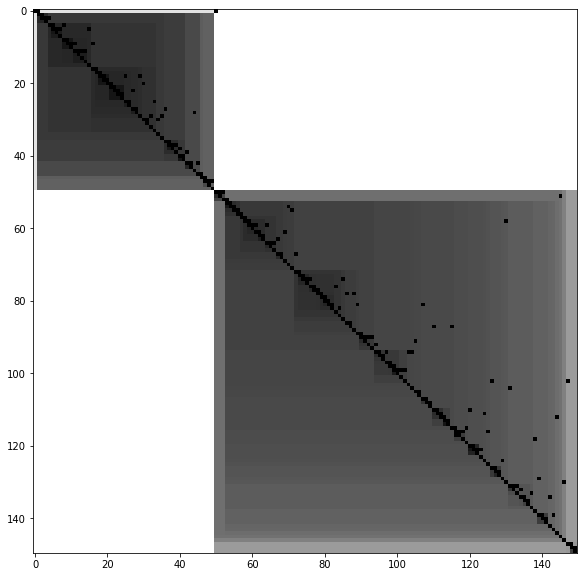
The ivat algorithm is a improved version of the vat algorithm which produce more precise images at the cost of a heavier computing cost
- metric function
Cluster validation metrics used in conjonction with the KMeans algorithm.
API
-
pyclustertend.hopkins.hopkins(data_frame, sampling_size)[source]¶ Assess the clusterability of a dataset. A score between 0 and 1, a score around 0.5 express no clusterability and a score tending to 0 express a high cluster tendency.
Parameters: - data_frame (numpy array) – The input dataset
- sampling_size (int) – The sampling size which is used to evaluate the number of DataFrame.
Returns: score – The hopkins score of the dataset (between 0 and 1)
Return type: float
Examples
>>> from sklearn import datasets
>>> from pyclustertend import hopkins
>>> X = datasets.load_iris().data
>>> hopkins(X,150)
0.16
-
pyclustertend.visual_assessment_of_tendency.compute_ivat_ordered_dissimilarity_matrix(X)[source]¶ The ordered dissimilarity matrix is used by ivat. It is a just a a reordering of the dissimilarity matrix.
Parameters: X (matrix) – numpy array Returns: D_prim – the ordered dissimalarity matrix . Return type: matrix
-
pyclustertend.visual_assessment_of_tendency.compute_ordered_dissimilarity_matrix(X)[source]¶ The ordered dissimilarity matrix is used by visual assesement of tendency. It is a just a a reordering of the dissimilarity matrix.
Parameters: X (matrix) – numpy array Returns: ODM – the ordered dissimalarity matrix . Return type: matrix
-
pyclustertend.visual_assessment_of_tendency.ivat(data, return_odm=False, figure_size=(10, 10))[source]¶ iVat return a visualisation based on the Vat but more reliable and easier to interpret.
Parameters: - data (matrix) – numpy array
- return_odm (return the Ordered Dissimalirity Matrix) – boolean (default to False)
- figure_size (size of the VAT.) – tuple (default to (10,10))
Returns: D_prim – the ivat ordered dissimalarity matrix.
Return type: matrix
-
pyclustertend.visual_assessment_of_tendency.vat(data, return_odm=False, figure_size=(10, 10))[source]¶ VAT means Visual assesement of tendency. basically, it allow to asses cluster tendency through a map based on the dissimiliraty matrix.
Parameters: - data (matrix) – numpy array
- return_odm (return the Ordered Dissimalirity Matrix) – boolean (default to False)
- figure_size (size of the VAT.) – tuple (default to (10,10))
Returns: ODM – the ordered dissimalarity matrix plotted.
Return type: matrix
-
pyclustertend.metric.assess_tendency_by_mean_metric_score(dataset, n_cluster=10, random_state=None)[source]¶ Assess the clusterability of a dataset using KMeans algorithm and the silhouette, calinski and davies bouldin score, the best cluster number is the mean of the result of the three methods.
Parameters: - dataset (numpy array, DataFrame) – The input dataset
- n_cluster (int) – The maxium number of cluster to consider
- random_state (int (default to None)) –
Returns: n_clusters
Return type: n_clusters is the mean of the best number of cluster score (with Kmeans algorithm)
Examples
>>> from sklearn import datasets
>>> from pyclustertend import assess_tendency_by_mean_metric_score
>>> from sklearn.preprocessing import scale
>>> X = scale(datasets.load_boston().data)
>>> assess_tendency_by_mean_metric_score(X,10)
2.6666666666666665
-
pyclustertend.metric.assess_tendency_by_metric(dataset, metric='silhouette', n_cluster=10, random_state=None)[source]¶ Assess the clusterability of a dataset using KMeans algorithm and a metric score, the best cluster number is the number that best scored with the silhouette score.
Parameters: - dataset (numpy array, DataFrame) – The input dataset
- metric (string) – The method to assess cluster quality (‘silhouette’, ‘calinski_harabasz’, ‘davies_bouldin’), default to ‘silhouette’
- n_cluster (int) – The maxium number of cluster to consider
- random_state (int (default to None)) –
Returns: - (n_clusters, value) (n_clusters is the number of cluster that best scored on the silhouette score on Kmeans.)
- As for value, it is the silhouette score for each number of cluster on KMeans.
Examples
>>> from sklearn import datasets
>>> from pyclustertend import assess_tendency_by_metric
>>> from sklearn.preprocessing import scale
>>> X = scale(datasets.load_boston().data)
>>> assess_tendency_by_metric(X, n_cluster=10)
(2, array([0.36011769, 0.25740335, 0.28098046, 0.28781574, 0.26746932,
    0.26975514, 0.27155699, 0.28883395, 0.29028124]))
Key Links and Resources: